I am quite happy that I could solve this problem in substantially less time than the previous. This time I solved in 31 minutes.
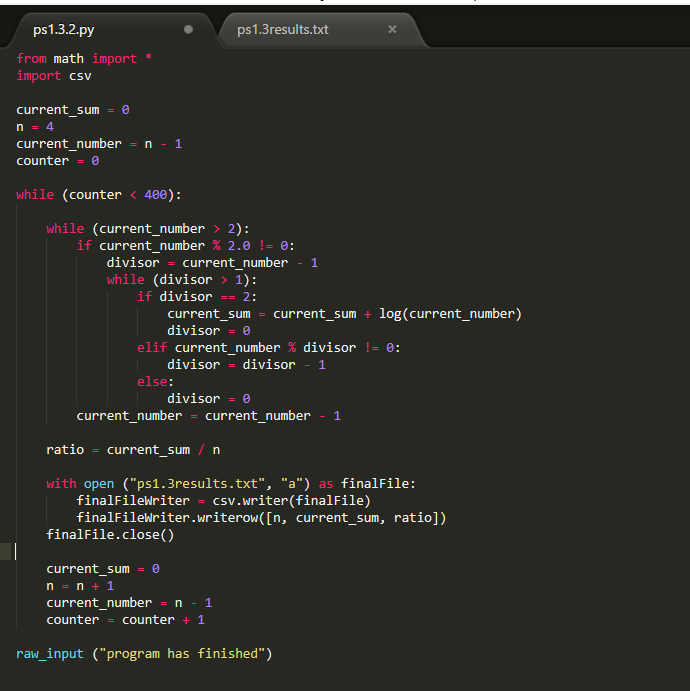
Problem: Basically write a program that takes a number and then adds the logs all the prime numbers less than the inputed number, and then displays that sum, the number and the division of both. (This is to prove that the langer the input number “n”, the closer the ratio of the sum of the logs smaller than “n” divided by “n” will be closer and closer to 0).
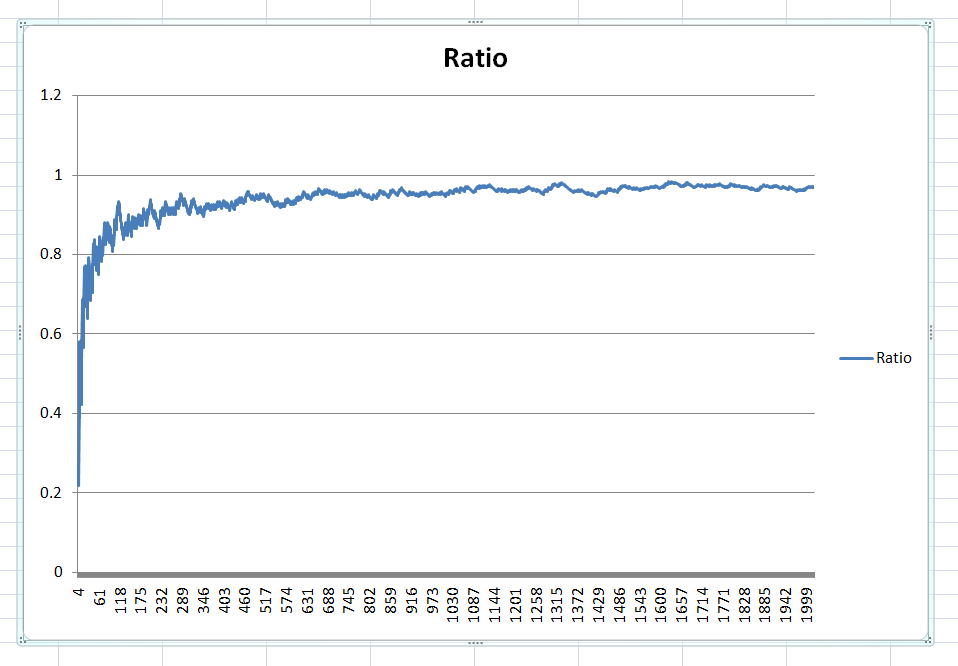
Indeed, in my program the more one increases n, the more the ratio is closer to 1.
It would be fun to print all different values of N and then make a graph. So I am gonna do that!
Learning how to print to excel:
I am using these videos to learn how to print to CSV. I will learn how to pass data to a CSV file, which is a file where values are sepparated by a comma and when you put it in excel it will put each value in the right column :).
It’s crazy how simple it was :D! Super happy with the results. I ahve been able for the previous exercise. to print on a CSV file the exercise for all values of N from 4 to 2000. The graph (on featured image above) clearly shows the “assimptote” towards 1.
Final code:

Another subtle learning:
I have noticed that the order in which some of my operations happen, is not the ideal. It doesn’t affect the program, but it affects my thinking and I want to improve this. So next time when I have some more time I will re-write the same program, but in the best possible order I can think of.


[…] Day 7 – MIT Course 6.00 – Assignment 1.2 + Bonus print to CSV […]